
Every ProfitPalms module, explained
ProfitPalms Analytics is a web application for professional sellers and brand owners. It works with data from your own selling account, which you connect through the official Selling Partner API. Below is a complete description of what each module shows and how sellers use it.
The whole story of a product on one chart
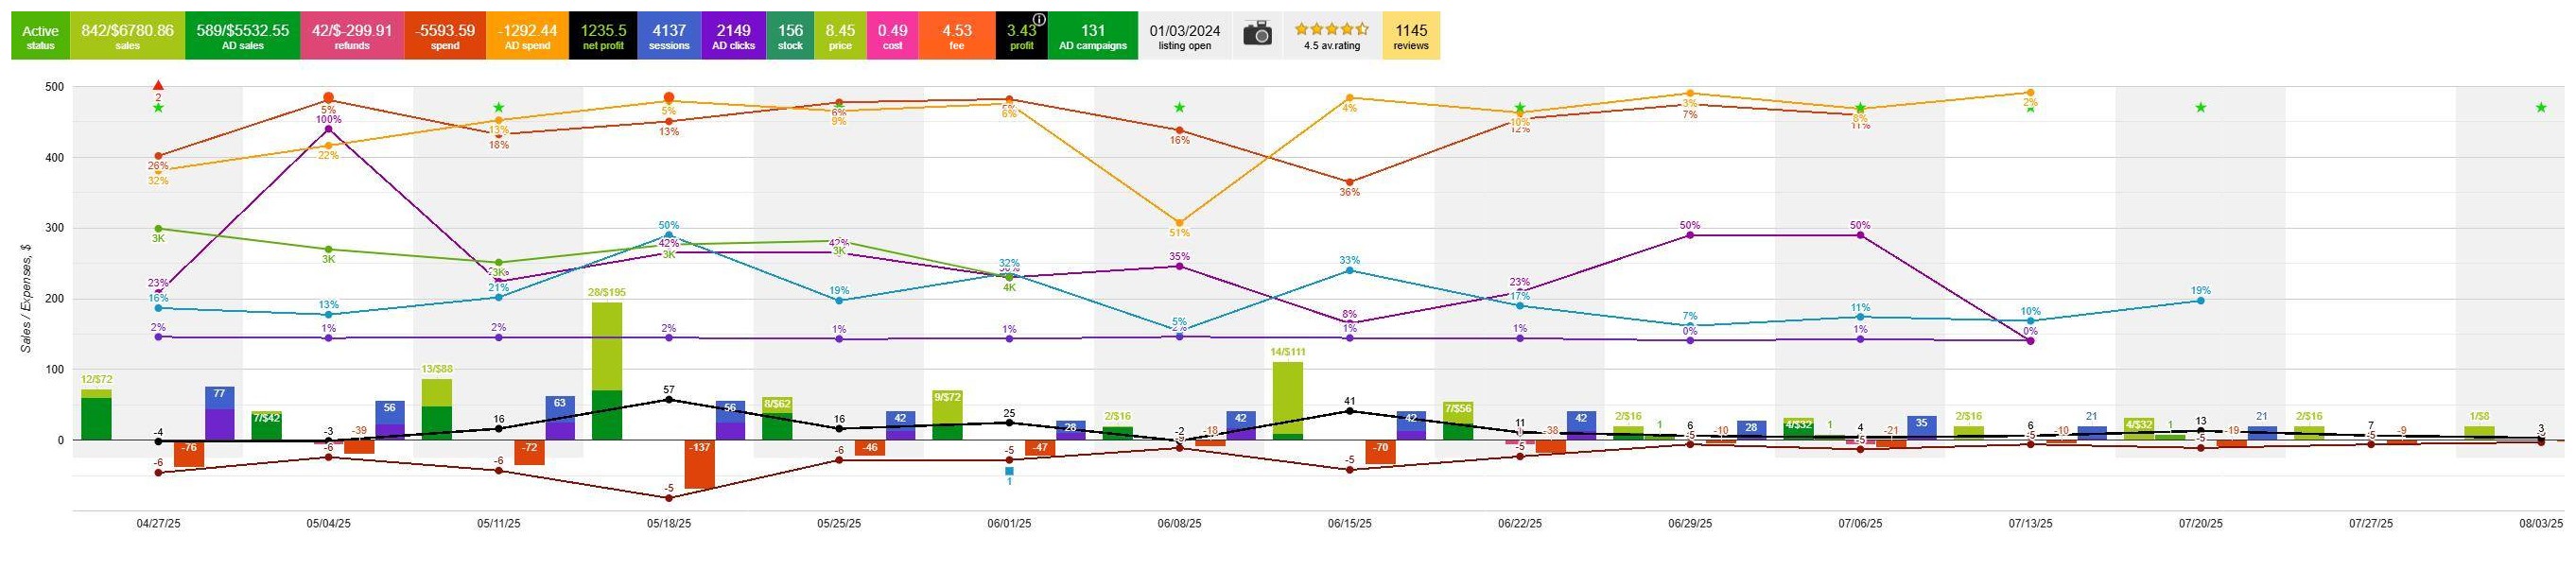
Pick any product and see its sales, refunds, costs, sessions, conversion, sales rank and profit for each week or month. Summary tiles above the chart show the totals for the period, and events such as a launch or an out-of-stock day are marked on the timeline.
- Group by week or month
- Sales, costs and profit on one timeline
- Events and tasks marked on the chart
Profit and Loss for any period
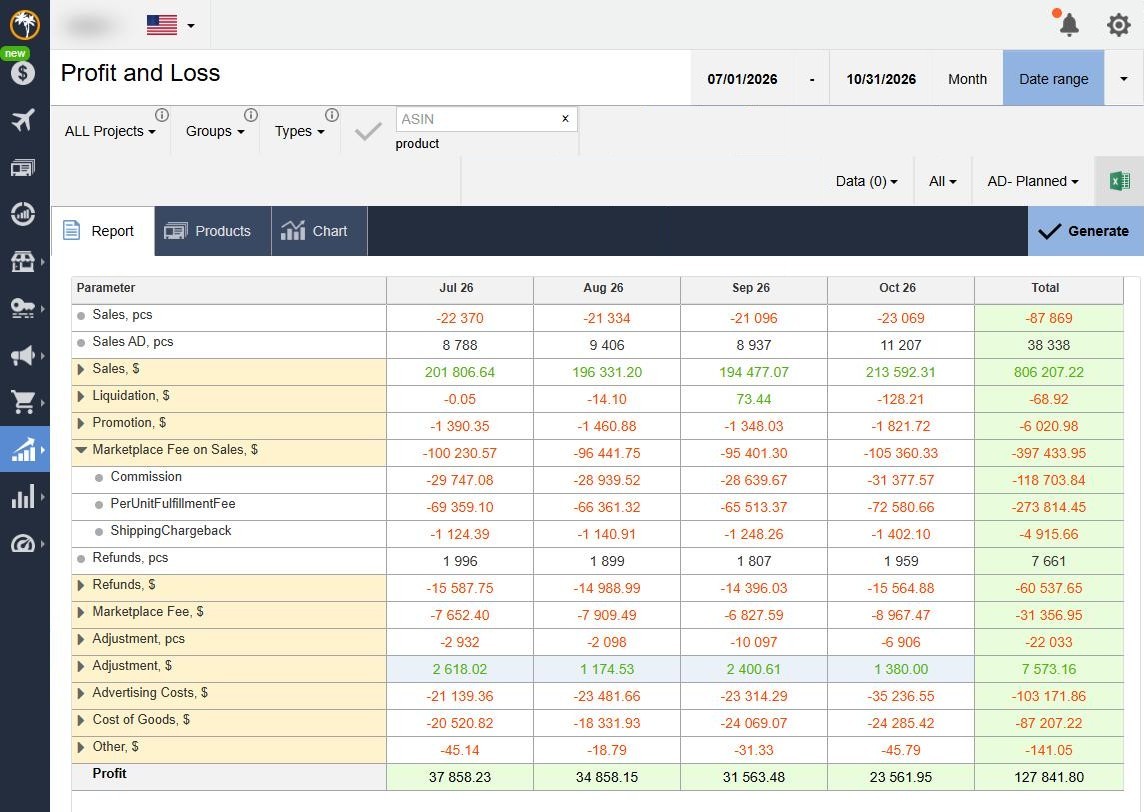
A monthly or custom-period P&L for the whole account, a project, a product group or a single product. Sales, promotions, marketplace fees, refunds, adjustments and cost of goods are itemized, and every line expands to show it by product.
- Report, product table and chart views
- Filter by project, group or type
- One-click Excel export
Know how long your stock will last
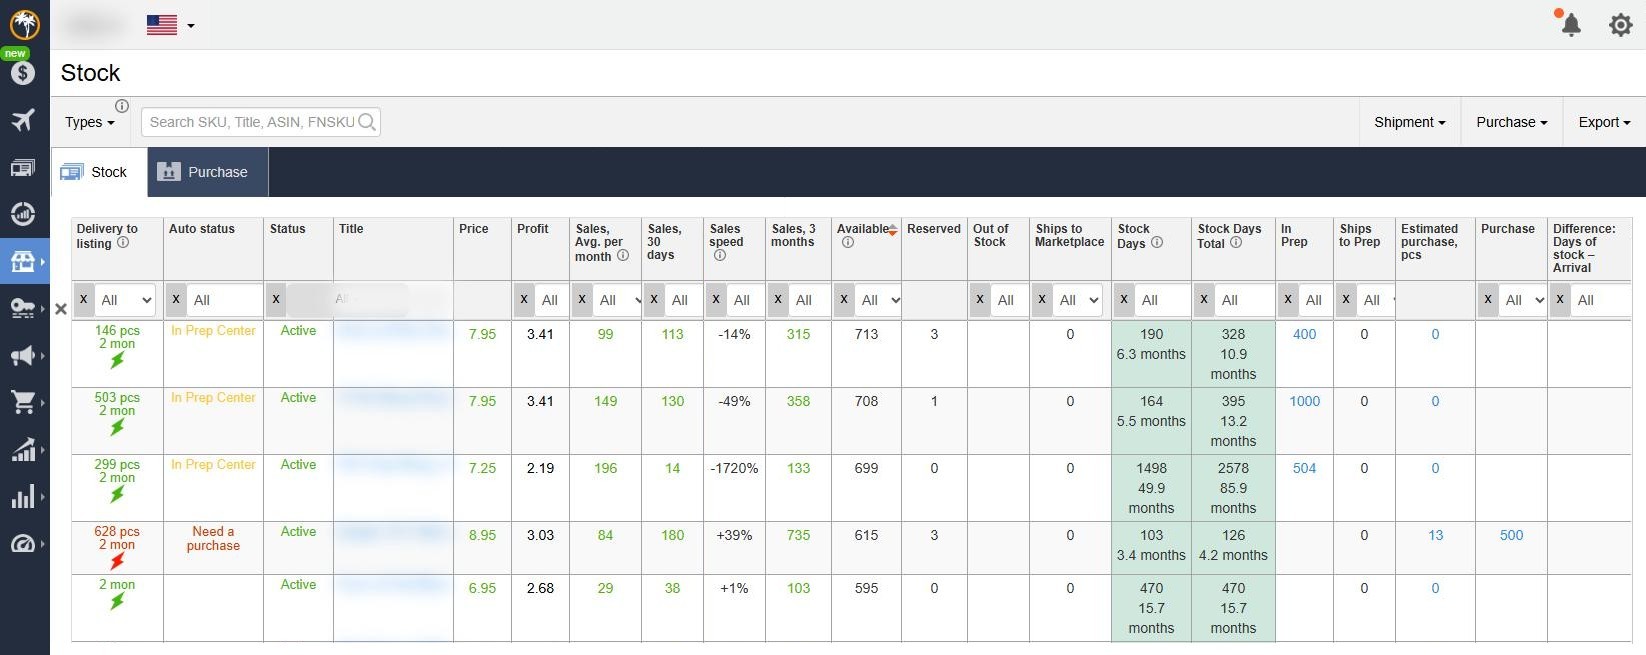
Every product in one table: price and profit per unit, average monthly sales, sales for the last 30 days and 3 months, and sales speed compared with the previous period. Next to it you see available and reserved units, units on the way to the fulfillment center and to your prep center, and stock held at the prep center. ProfitPalms turns this into days of stock at the fulfillment center and in total, an automatic status such as "Need a purchase", a suggested purchase quantity and the gap between days of stock and the next arrival.
- Days of stock: fulfillment center and total
- Auto status and suggested purchase quantity
- Sales speed vs. the previous period
Know where your products rank
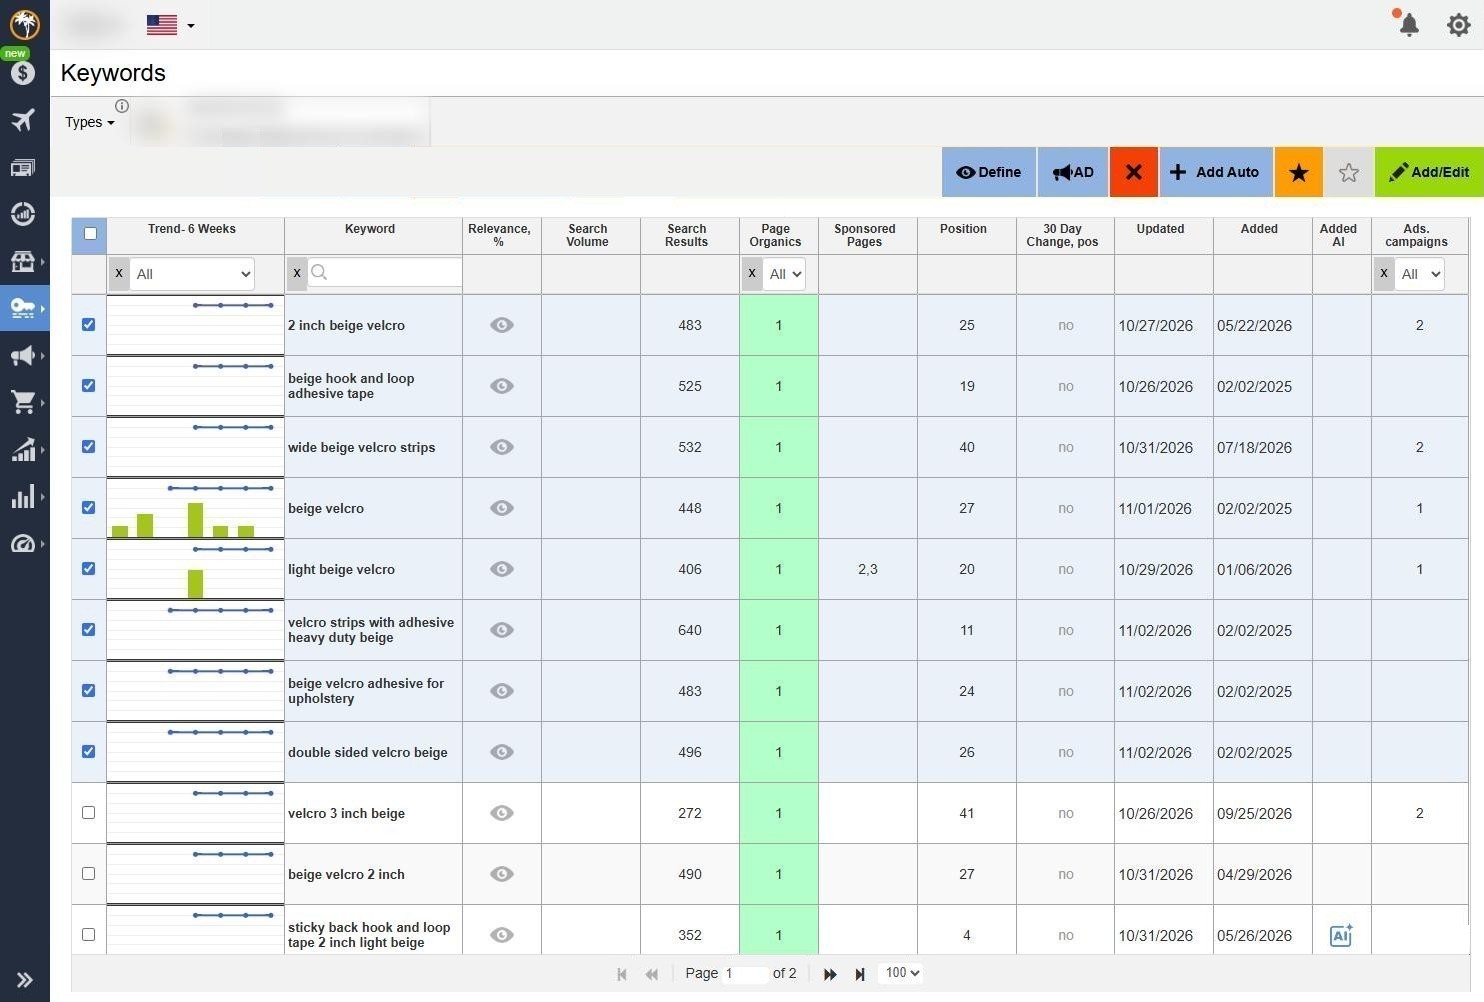
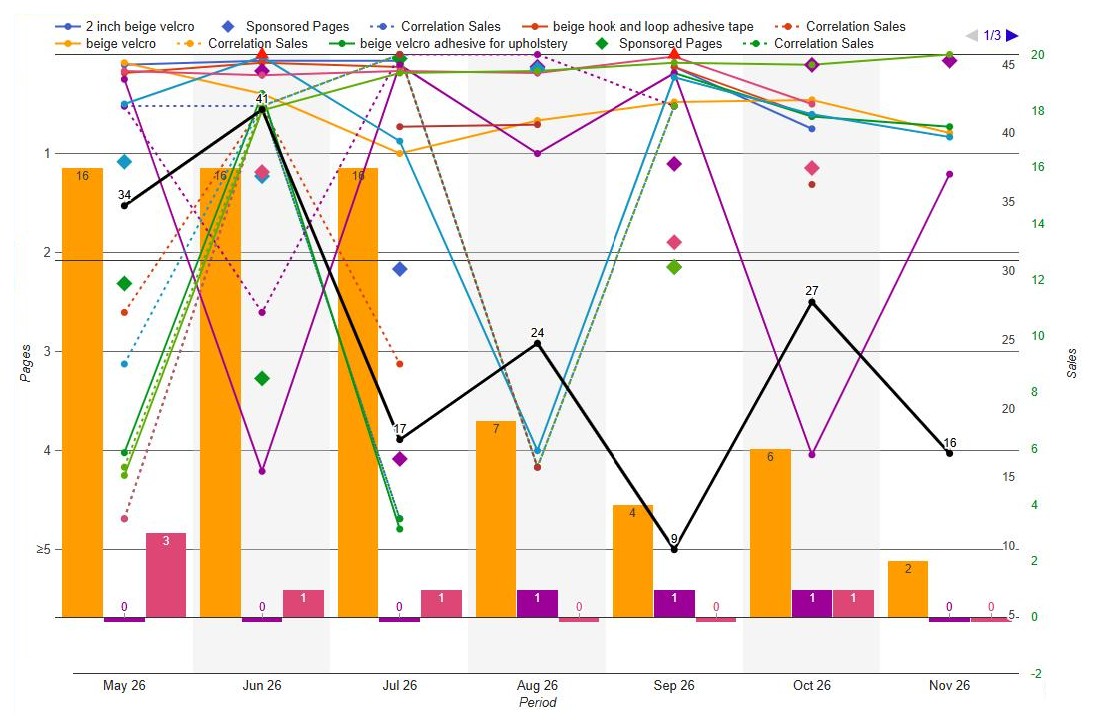
Choose the keywords that matter for each of your products. For every keyword ProfitPalms shows a six-week trend, relevance, search volume, the number of search results, the page and position where your product appears, the 30-day change, and when the keyword was added and last updated. The chart under the table puts keyword positions on a timeline together with your monthly sales, so you can see how rank and sales move together.
- Six-week trend and 30-day change
- Page and position for every keyword
- Rank history next to sales on one chart
Search funnel for your own brand
For brand owners enrolled in Brand Registry: the search queries that lead shoppers to your brand, and how impressions turn into clicks, cart adds and purchases for your brand compared with the query total. Shown only to the brand owner who authorized the data.
- Search Query & Catalog Performance
- Market Basket & Repeat Purchase
- Aggregated data, no buyer PII
Light bar: query total · Dark bar: your brand. Illustration with sample data.
Economics & Profit and Loss
Turns orders, settlements and financial events into a clear profit picture for any period, from the whole account down to a single product.
Source: orders, financial events, settlement reportsProfit and Loss report
Monthly or custom date range. Lines for units, sales, liquidations, promotions, marketplace fees, refunds, adjustments, cost of goods, other costs and net profit. Expand any line to see it by product.
Profitability of products
A sortable table of every product with sales, costs, profit per unit and margin, so you see which items earn money and which only add revenue.
Projects & product groups
Group products into projects or groups (for example by brand line or supplier) and get a separate P&L for each one.
Financial events
Every financial event from your account, searchable and filterable, for reconciliation and for checking unexpected fees or adjustments.
External payments & product cost
Add your own product cost and costs paid outside the marketplace (production, freight, prep) so the profit figure is complete.
Accounting export
Export P&L and product tables to Excel, or send summaries to your accounting software.
Product dashboard & analysis
One place for everything about a product. Pick a product and see its status, history, stock, economics and sales trend on a single page.
Source: sales & traffic, catalog, inventory, ordersSummary tiles
Status, units and sales, refunds, total costs, net profit, sessions, stock, price, product cost, fee and profit per unit, rating and review count.
Checklist & planning
A per-product checklist for the team: what is done and what is planned for the listing, stock and launch.
Listing status & history
Current listing status, plus a history of price changes and edits to title, images and other content of your own listing.
Variations
All variations of a product family with their last-30-day sales, so you see which sizes or colors carry the family.
Stock & sales velocity
Stock at the fulfillment center, reserved, inbound and at your prep center, with average daily sales and days of cover.
Monthly analysis chart
Sales, refunds, sessions, conversion, sales rank and profit by week or month, with events such as a new listing or out-of-stock marked on the chart.
Inventory & purchasing
Keeps the supply chain visible from the supplier to the fulfillment center, so you reorder on time and avoid paying for stock that does not sell.
Source: inventory, inbound shipment & storage reportsStock overview
Available, reserved and inbound units for every product, with automatic statuses such as "In prep center" or "Need a purchase".
Stock analysis
Days of cover and recommended reorder quantity based on recent sales velocity and your lead time.
Planned purchases & suppliers
Plan purchase orders, keep purchasing sources and prices per product, and track what is already ordered.
Prep centers & boxes
Stock held at your prep centers, box configurations, and what is ready to ship to the fulfillment center.
Shipments
Inbound shipments with their status and received quantities, so you know when stock becomes available.
Long-term storage
Products at risk of long-term storage fees, so you can plan promotions or removals before fees apply.
Keyword rank tracking
Shows where your own products appear in organic search for the keywords you care about, and how that changes over time.
Source: your catalog & search dataPositions table
For each keyword: six-week trend line, relevance, search volume, number of search results and the page and position of your product.
Keyword charts
Position history for any keyword on a chart, together with your listing changes and events.
Add keywords your way
Add keywords manually, in bulk, or let ProfitPalms suggest them from your listing content.
Filters by product
Switch between your products and product types to review rank for a whole catalog line.
Orders & returns
Order-level statistics for your products without any buyer personal information.
Source: orders (without buyer PII), returns reportsOrder statistics
Orders by day, product and fulfillment type, with sales counted by order date or by payment date.
Customer returns
Returned units by product and by return reason, so you can fix listing or quality issues behind returns.
Ratings & reviews count
Average rating and number of reviews for each of your products over time.
Sales dashboard
Sales trend for the whole account with comparison to previous periods.
Changes & statistics
Answers the question "what happened, and when?" across your catalog.
Source: catalog, listings, inventory & shipment dataChange log
Every detected change on your own listings (price, title, images, status) with date and before/after values.
Out-of-stock statistics
When each product was out of stock and for how long, so you can measure lost sales and fix the cause.
New listings & launches
Track new products from the first stock arrival through the launch period.
Events
Add your own events (a new photo set, a promotion, a supplier change) and see them on every chart.
Tasks & team
Turns insights into work that gets done, with clear owners and dates.
Source: data entered by your teamTasks per product
Create tasks from any product page, assign an owner and a due date, and see them on the product timeline.
Gantt chart
A Gantt view of all tasks across products to plan launches, purchases and listing work.
Team statistics
Completed tasks per team member and per period.
Roles & access
Invite colleagues to your workspace; only invited users can see your data.
Brand Analytics
For brand owners enrolled in Brand Registry. Uses Brand Analytics reports for brands the seller owns, and shows them only to that seller.
Source: Brand Analytics reportsSearch Query Performance
Search queries that lead shoppers to your brand, with impressions, clicks, cart adds and purchases for your brand next to the query total.
Search Catalog Performance
The same search funnel per product in your catalog, to find listings that are seen but not chosen.
Search Terms
Search frequency rank of terms and the click and conversion share of your own products, to guide keyword choice in listing copy.
Market Basket & Repeat Purchase
Products bought together with yours, and aggregated repeat-purchase counts, to plan bundles and refill offers within your brand.
Brand Analytics data contains aggregated store metrics and no buyer personal information. It is never combined across sellers or brands. See Data Use & Security.
Accounts, regions & export
Built for sellers with more than one account or region.
Source: your authorized accountsMultiple accounts
Connect several of your own selling accounts and switch between them, or view all of them together.
Multiple regions
United States, Canada, Mexico, United Kingdom and other regions you authorize, each with its own currency.
Export data
Export any table to Excel or CSV for your own analysis.
Notifications
In-app notifications about stock, out-of-stock products and tasks.
Questions about a feature?
Write to us and we will show how it works on your own data.